English
What Your Health Dashboard Should Actually Show You

Introduction
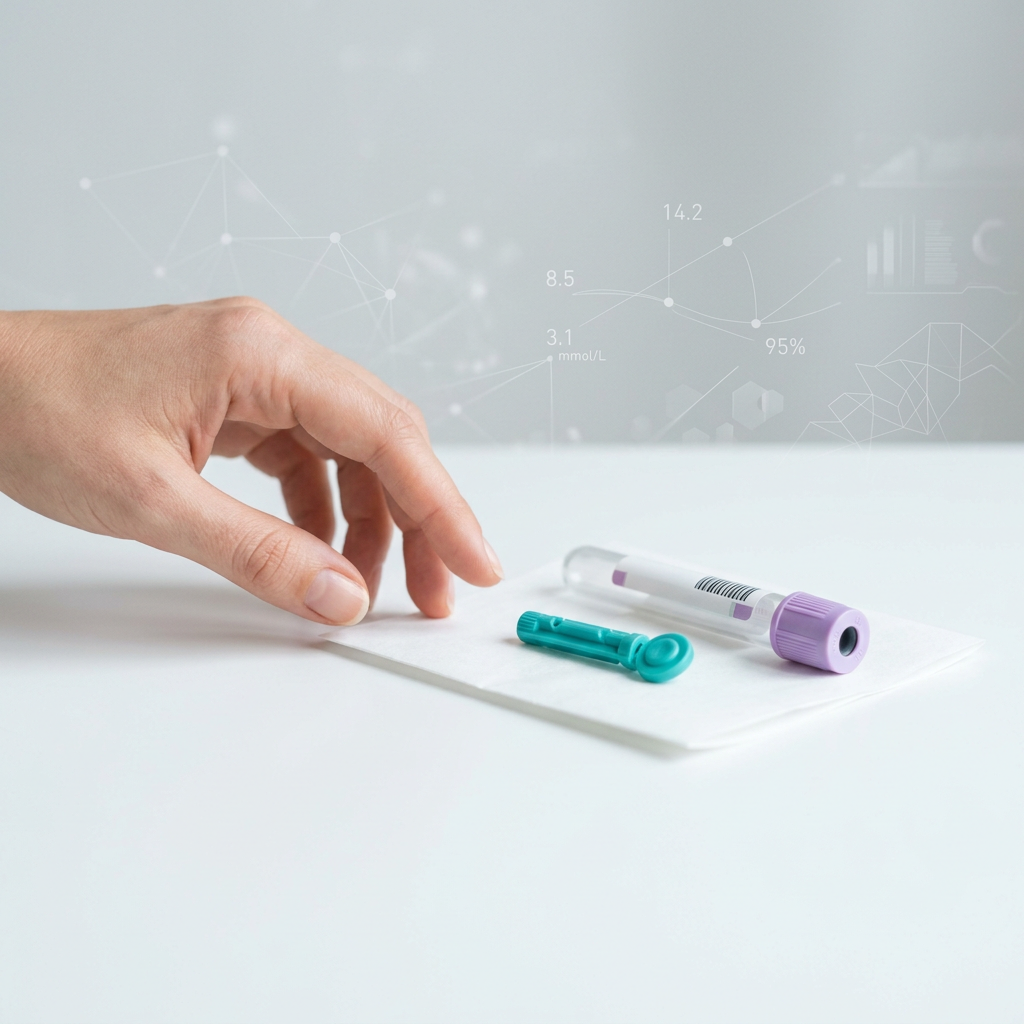
Annual checkups typically end with a printed sheet of lab values, a few circled numbers, and a brief "everything looks fine" from your doctor. That fragmented snapshot tells you almost nothing about where your health is trending or which risks are quietly building beneath the surface. A personalized health dashboard changes this dynamic entirely by consolidating biomarker data, health scores, and trend lines into a single view designed for proactive decision-making. For health-conscious Canadians tired of guessing, the difference between a basic lab printout and a true health metrics dashboard is the difference between reacting to disease and preventing it.
Core Data Categories Every Health Dashboard Needs
A well-designed health monitoring platform goes far beyond listing your cholesterol and blood glucose. It organizes information into meaningful categories that tell a story about your body, your risks, and the interventions most likely to move the needle. If your current tool does not give you at least the following layers of data, you are working with an incomplete picture.
Essential Biomarkers and What They Reveal
The foundation of any useful dashboard is biomarker data. Biomarkers are measurable indicators of biological processes, and the FDA defines them as characteristics that can be objectively measured and evaluated as indicators of normal or pathological processes. A preventive care dashboard should present these biomarkers with context, not just raw numbers. Here are the categories your dashboard should include:
Metabolic markers: Fasting glucose, HbA1c, and insulin levels that signal how efficiently your body processes energy and whether insulin resistance is developing.
Cardiovascular markers: LDL and HDL cholesterol, triglycerides, ApoB, and high-sensitivity CRP, which together paint a far more accurate picture of heart disease risk than total cholesterol alone.
Thyroid function: TSH, free T3, and free T4 levels that indicate whether your thyroid is supporting or undermining your energy, metabolism, and mood regulation.
Hormonal panel: Testosterone, estradiol, DHEA-S, and cortisol, which influence everything from sleep quality and recovery to body composition and stress resilience.
Nutrient and inflammation markers: Vitamin D, B12, ferritin, and inflammatory markers like homocysteine that reveal hidden deficiencies and chronic low-grade inflammation.
Biological Age vs. Chronological Age
One of the most powerful features a health dashboard can offer is a biological age calculation. Unlike your chronological age, biological age reflects how your body is actually aging at the cellular level. Research into epigenetic clocks has shown that the rate of biological ageing varies significantly between individuals and responds to lifestyle changes. A dashboard that compares your biological age to your chronological age gives you a single, intuitive metric for understanding your overall health trajectory.
This comparison also creates accountability. When someone who is 42 sees a biological age of 38, it reinforces the value of their current habits. When they see 47, it triggers a meaningful conversation about what needs to change. Without this context, lab numbers exist in a vacuum where "normal" ranges may mask a gradual decline.
Features That Separate Meaningful Dashboards from Basic Ones
Displaying biomarkers is table stakes. The real value of a wellness data platform lies in how it contextualizes, tracks, and translates that data into decisions you can act on. The features below represent the dividing line between tools that inform and tools that actually improve outcomes.
Longitudinal Tracking and Trend Visualization
A single blood test tells you where you stand today. Longitudinal health tracking tells you where you are heading. The best dashboards plot your biomarkers over time so you can see whether your vitamin D is climbing after supplementation, whether your fasting glucose is creeping upward quarter over quarter, or whether your inflammatory markers have stabilized since you changed your diet.
This is where many standard health tools fall short. Traditional checkups, as documented by Statistics Canada's health surveys, tend to capture isolated moments rather than continuous patterns. A dashboard built for trend analysis transforms scattered data points into a coherent narrative about your body. Biomi builds this directly into its online health records dashboard, allowing users to compare results across multiple testing periods and spot meaningful shifts before they become clinical problems.
Personalized Health Scores and Actionable Insights
Raw biomarker values have limited utility for most people. Knowing your LDL is 142 mg/dL means nothing without understanding where that falls relative to your age, sex, risk profile, and health goals. A strong health score tracking system converts complex lab data into simple, interpretable scores that highlight areas of strength and areas that need attention.
Personalized health insights go further than generic wellness advice. They connect your specific results to specific actions: adjusting a supplement dose, changing meal timing, prioritizing sleep, or scheduling a follow-up test. This is the distinction between personalized health insights and generic wellness recommendations. A dashboard that says "your vitamin D is low" is marginally useful. One that says "your vitamin D has dropped 18% since your last test, here is what to adjust" is genuinely actionable.

Conclusion
A health dashboard worth using does more than list numbers from your last blood draw. It consolidates key biomarkers, tracks them over time, calculates your biological age, and delivers personalized scores with clear next steps. For anyone serious about preventive care, whether managing their own wellness or evaluating a corporate wellness platform for their team, the standard should be a tool that turns complexity into clarity. Choosing the right dashboard is not about having more data; it is about having the right data, presented in a way that drives better decisions every quarter.
Explore how Biomi's dashboard transforms your biomarker data into a clear, actionable health plan.
Frequently Asked Questions (FAQs)
What does a comprehensive health dashboard show?
A comprehensive health dashboard shows biomarker results, trend graphs over time, biological age comparisons, personalized health scores, and actionable recommendations tailored to your specific data.
How can I track my health biomarkers?
You can track biomarkers through regular blood testing, either via clinical labs or at-home collection kits, with results uploaded to a digital platform that visualizes changes over time.
What is included in a health score?
A health score typically aggregates multiple biomarker values into a single rating that reflects your overall metabolic, cardiovascular, hormonal, and inflammatory status relative to optimal ranges.
How often should I do blood work?
For proactive health monitoring, blood work every three to six months provides enough data points to identify meaningful trends without over-testing.
What health markers indicate longevity?
Markers most associated with longevity include fasting glucose, HbA1c, high-sensitivity CRP, ApoB, vitamin D, and hormonal balance indicators like DHEA-S and cortisol.
About the author

Medical Research Content Advisor
Combines medical research and functional medicine expertise to create educational content on health biomarkers, disease prevention, and longevity.
Related articles
- Iron Deficiency Symptoms, Causes & Treatment: A Complete Guide
Learn how to recognize iron deficiency symptoms, understand root causes, and explore proven treatments. Discover how biomarker testing helps you track and improve your iron levels.
- How Often Should You Track Blood Biomarkers for Real Results?
Learn how often you should retest blood biomarkers to track real health progress. Get evidence-based retesting schedules for longevity and performance goals.
- Health Dashboard vs Fitness Tracker: Which Actually Improves Wellness?
Health dashboard or fitness tracker—which truly reveals your wellness? Discover how biomarker tracking outperforms wearables for preventive health insights.
- How Chronic Inflammation Accelerates Aging and How to Stop It
Learn how chronic inflammation speeds up aging and what you can do to stop it. Discover actionable steps, key biomarkers, and testing options available in Canada.
- Micronutrient Deficiency: Signs, Testing, and How to Fix It
Learn to spot micronutrient deficiency symptoms, understand blood testing options in Canada, and discover how to restore optimal levels for lasting energy and health.
Read article: Iron Deficiency Symptoms, Causes & Treatment: A Complete GuideRead article: How Often Should You Track Blood Biomarkers for Real Results?Read article: Health Dashboard vs Fitness Tracker: Which Actually Improves Wellness?Read article: How Chronic Inflammation Accelerates Aging and How to Stop ItRead article: Micronutrient Deficiency: Signs, Testing, and How to Fix It