English
Fasting Glucose Levels: What's Normal by Age
Par Dr. Emily Carter

Introduction
A fasting glucose test is one of the most common blood tests ordered in Canada, yet many people glance at the number on their lab report without fully understanding what it means for their health. The normal fasting glucose level shifts as you age, and a reading that looks acceptable at 25 may signal a different metabolic trajectory at 55. Compounding the confusion, standard lab reference ranges often present a single "normal" bracket that ignores age, sex, and lifestyle context entirely. For anyone serious about preventive health, understanding where your fasting blood sugar sits relative to age-specific thresholds is the difference between catching a problem early and missing it completely.
Key Takeaway: A fasting glucose level between 4.0 and 5.5 mmol/L (72 to 99 mg/dL) is generally considered normal, but optimal ranges narrow with age, and even readings within the "normal" bracket can trend toward prediabetes if you are not tracking them over time.
Understanding Fasting Glucose and Why It Matters
Fasting blood glucose measures the concentration of sugar in your bloodstream after an overnight fast, typically eight to twelve hours without food. It reflects how efficiently your body manages glucose when no new fuel is coming in, making it a direct window into your baseline metabolic function and insulin sensitivity.
How Fasting Glucose Is Measured
A fasting glucose test requires you to abstain from all food and caloric beverages for at least eight hours before the blood draw; water is permitted and encouraged. The sample is analyzed for plasma glucose concentration, reported in either mmol/L (standard in Canada) or mg/dL. Several factors can influence accuracy on any given day.
Fasting duration: Eating or drinking anything caloric within eight hours can artificially elevate results
Sleep quality: Poor or disrupted sleep the night before can raise cortisol, which increases morning glucose
Medications: Corticosteroids, beta-blockers, and certain diuretics may push readings higher
Stress response: Acute physical or emotional stress triggers glucose release from the liver
What the Numbers Mean: Normal, Prediabetic, and Diabetic Thresholds
Canadian preventive health guidelines align closely with international standards for diagnostic criteria for diabetes, categorizing fasting glucose into three primary brackets. A reading below 5.6 mmol/L (100 mg/dL) is classified as normal. Between 5.6 and 6.9 mmol/L (100 to 125 mg/dL) falls into the prediabetes range, sometimes called impaired fasting glucose. A reading at or above 7.0 mmol/L (126 mg/dL) on two separate occasions meets the threshold for a diabetes diagnosis. These cutoffs represent clinical consensus, but they do not capture the full picture. A fasting glucose of 5.4 mmol/L in a 30-year-old may warrant closer scrutiny than the same number in a 65-year-old, because research consistently shows that optimal vs normal biomarker ranges diverge significantly across age groups.
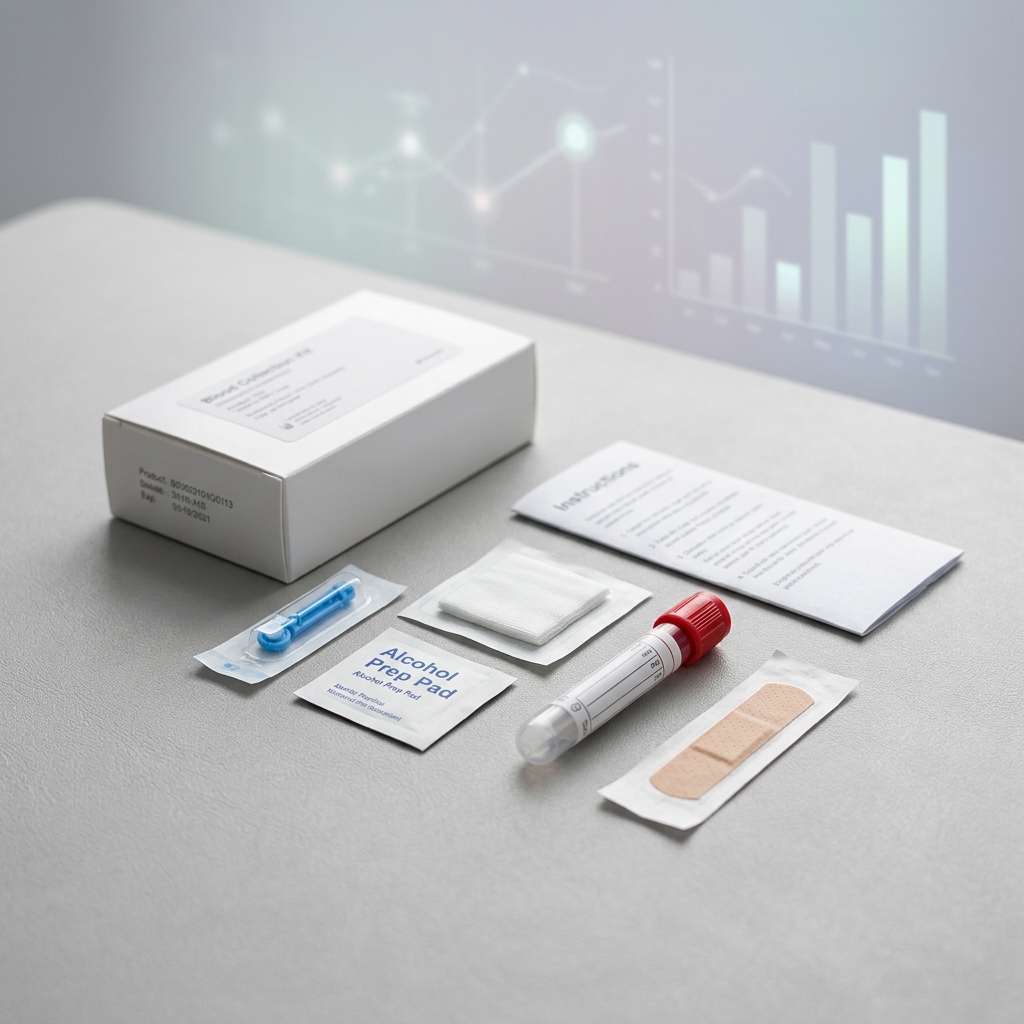
Fasting Glucose Levels by Age: A Practical Reference
Fasting glucose does not remain static across your lifespan. Research shows that average readings tend to climb gradually with age due to declining insulin sensitivity, changes in body composition, and shifts in hormonal regulation. Knowing what is typical for your age group provides a more meaningful benchmark than a single universal range.
Fasting Glucose Chart by Age Group
The table below summarizes approximate healthy fasting glucose ranges alongside commonly observed averages for each age group, based on prospective cohort data examining glucose by age and sex. Note that these are population-level observations; individual variation is significant and influenced by genetics, diet, activity level, and overall metabolic health.
Age Group | Optimal Range (mmol/L) | Optimal Range (mg/dL) | Typical Average (mmol/L) | Key Notes |
|---|---|---|---|---|
18 to 29 | 4.0 – 5.2 | 72 – 94 | 4.6 – 4.9 | Insulin sensitivity is generally highest in this bracket |
30 to 39 | 4.0 – 5.3 | 72 – 95 | 4.8 – 5.1 | Early lifestyle habits begin shaping metabolic trajectory |
40 to 49 | 4.2 – 5.5 | 76 – 99 | 5.0 – 5.3 | Screening becomes particularly important in this decade |
50 to 59 | 4.2 – 5.6 | 76 – 101 | 5.1 – 5.5 | Prediabetes risk rises; regular tracking is recommended |
60+ | 4.4 – 5.8 | 79 – 104 | 5.3 – 5.7 | Higher averages are common but not inherently benign |
The most actionable insight from this chart is that a reading of 5.5 mmol/L carries different clinical weight depending on your age. For someone in their twenties, it sits at the high end of optimal and may signal emerging insulin resistance worth investigating. For someone over 60, the same number is closer to the population average. This is precisely why a fasting glucose levels explained approach that accounts for context outperforms a simple pass/fail interpretation.
Why Age-Specific Context Matters for Early Detection
Fasting glucose prediabetes often develops silently over years. A gradual upward trend in your readings, even while technically remaining within the "normal" range, can indicate declining metabolic function long before you cross a clinical threshold. This is where preventive care vs reactive early screening becomes critical. Waiting until glucose hits 6.0 mmol/L before taking action means missing the window where lifestyle changes are most effective.
Fasting glucose early detection through regular testing allows you to spot these trends before they harden into a diagnosis. Research on glucose variability and mortality risk demonstrates that even modest, sustained elevations correlate with long-term cardiovascular and metabolic risk. A platform like Biomi makes this kind of longitudinal tracking practical by converting repeated blood test data into trend lines and health scores that reveal direction, not just a snapshot.

Fasting Glucose vs Other Screening Tools
Fasting glucose is a valuable screening metric, but it is not the only one available. Understanding how it compares to other diagnostic tools helps you and your healthcare provider build a more complete picture of metabolic health.
Fasting Glucose vs A1C: Choosing the Right Test
Fasting glucose vs A1C is one of the most common comparisons in diabetes screening. Fasting glucose provides a real-time measurement of blood sugar after an overnight fast. A1C (hemoglobin A1C) measures the percentage of hemoglobin molecules that have glucose attached, reflecting your average blood sugar over the preceding two to three months.
Each test has distinct strengths. Fasting glucose is more sensitive to acute changes and is the go-to for diagnosing diabetes at a specific point in time. A1C is better at revealing long-term glucose control and is not affected by a single night of poor sleep or one stressful morning. However, A1C can be skewed by conditions that affect red blood cell turnover, including iron deficiency anemia, recent blood loss, or certain hemoglobin variants. The metabolic biomarkers true health status approach combines both tests along with related markers to deliver a more reliable overall assessment.
Where the Oral Glucose Tolerance Test Fits In
The oral glucose tolerance test (OGTT) measures how your body processes a standardized glucose load over two hours. It is more sensitive than fasting glucose alone for identifying impaired glucose tolerance, particularly in people whose fasting numbers look normal but whose post-meal responses are already compromised. The OGTT is less convenient, requiring you to drink a glucose solution and sit in a clinic for two hours, which limits its use in routine preventive screening. For most Canadians pursuing regular biomarker trends and longitudinal tracking, a combination of fasting glucose and A1C tested every six to twelve months provides a practical and clinically robust monitoring strategy. Biomi's at-home collection options and secure dashboard make this kind of consistent tracking significantly easier to maintain over time.
Taking Action on Your Results
Understanding your fasting glucose result is only useful if it leads to informed decisions. Whether your reading falls within the optimal zone or edges toward the prediabetic range, the response should be proportional and evidence-based.
Lifestyle Strategies That Influence Fasting Glucose
Consistent physical activity is one of the most effective levers for improving insulin sensitivity and lowering fasting glucose. Even moderate daily movement, such as a 30-minute walk, has been shown to produce measurable improvements over weeks. Dietary patterns matter as well: reducing refined carbohydrates, increasing fiber intake, and prioritizing whole foods help stabilize blood sugar regulation throughout the day and overnight. Sleep duration and quality play a surprisingly direct role. Chronic sleep restriction (fewer than six hours per night) impairs glucose metabolism and can push fasting readings higher regardless of diet. Managing stress through consistent routines, adequate rest, and targeted activity addresses the high fasting glucose morning causes that many people notice but rarely connect to their broader metabolic picture.
Why Longitudinal Tracking Outperforms One-Off Tests
A single fasting glucose reading is a data point, not a diagnosis. The real value emerges when you compare readings over months and years, identifying trends that reveal whether your metabolic health is improving, stable, or declining. Two to four measurements per year provide enough data to detect meaningful shifts before they become clinical problems. Tracking multiple key biomarkers for long-term health alongside glucose, including insulin, triglycerides, and inflammatory markers, creates a metabolic health score that is far more informative than any single number.
Conclusion
Your fasting glucose result is most meaningful when viewed through the lens of your age, your personal trend over time, and the broader context of your metabolic markers. Knowing that a healthy fasting glucose for your age group sits within a specific range gives you a sharper benchmark than generic lab reference values alone. Proactive, preventive glucose screening paired with consistent tracking is the most reliable way to catch insulin resistance early and make course corrections while lifestyle changes still have the greatest impact. Use every test result not as a verdict, but as a compass pointing toward better decisions.
Frequently Asked Questions (FAQs)
What is a normal fasting glucose level?
A normal fasting glucose level is below 5.6 mmol/L (100 mg/dL), though optimal readings typically fall between 4.0 and 5.2 mmol/L depending on your age group.
What should fasting glucose be by age?
Optimal fasting glucose ranges widen slightly with age, from approximately 4.0 to 5.2 mmol/L for adults under 30 to 4.4 to 5.8 mmol/L for those over 60.
Is 110 fasting glucose normal?
A fasting glucose of 110 mg/dL (6.1 mmol/L) falls into the prediabetic range and warrants follow-up testing and lifestyle evaluation with your healthcare provider.
How long do you need to fast before a glucose test?
You should fast for at least eight hours before a glucose test, avoiding all food and caloric beverages while continuing to drink water normally.
How can you lower fasting glucose naturally?
Regular physical activity, reducing refined carbohydrate intake, improving sleep quality, and managing chronic stress are the most effective evidence-based strategies for lowering fasting glucose without medication.
Fasting glucose vs A1C: which is more accurate?
Neither is universally more accurate; fasting glucose captures real-time blood sugar while A1C reflects a two-to-three-month average, and using both together provides the most reliable metabolic assessment.
What causes high fasting glucose in the morning?
High morning fasting glucose is commonly caused by the dawn phenomenon (a natural cortisol surge), poor sleep, evening snacking, or underlying insulin resistance that impairs overnight glucose regulation.
À propos de l'auteur

Senior Health Content Strategist
Specializes in preventive health, biomarker analysis, and longevity science.
Articles connexes
- Biological Age Blood Test: What It Measures and Why It Matters
Curious about your biological age blood test results? Explore key biomarkers, what they reveal, and how to start optimizing your longevity today.
- At-Home Blood Draw for Health Testing in Calgary: How It Works
Discover how at-home blood draw testing works in Calgary, from booking to physician-reviewed results. Book your mobile blood collection today.
- What Is Biomi? Biomarker Testing and Biological Age Explained
Discover what Biomi is and how biomarker tracking reveals your biological age vs chronological age. Start your health journey today.
- Home Blood Draw: What to Expect Before Your Appointment
Booking a home blood test? Learn exactly what to expect before your appointment, from prep tips to physician-reviewed results with Biomi.
- What Is Longevity Testing? How It Works and What to Expect
Curious about longevity testing? Learn how this biomarker blood test works, what to expect, and how it reveals your biological age. Start today.
Lire l'article: Biological Age Blood Test: What It Measures and Why It MattersLire l'article: At-Home Blood Draw for Health Testing in Calgary: How It WorksLire l'article: What Is Biomi? Biomarker Testing and Biological Age ExplainedLire l'article: Home Blood Draw: What to Expect Before Your AppointmentLire l'article: What Is Longevity Testing? How It Works and What to Expect