English
Optimal vs Normal Biomarker Ranges: Why Your Results May Mislead You

Introduction
You get your blood work back, scan the results, and see the word "normal" next to every line item. Relief sets in. But that reassuring label may be hiding a more complicated story. Standard reference ranges used in biomarker test interpretation are derived from broad population data that includes people with undiagnosed conditions, chronic inflammation, and metabolic dysfunction. The gap between a "normal" result and a truly optimal one can mean the difference between catching a health issue years early and missing it entirely until symptoms demand attention.
How Standard Reference Ranges Are Built
Before questioning your results, it helps to understand where those "normal" numbers actually come from. The methodology behind standard reference ranges reveals why they are not designed to tell you whether you are thriving, only whether you are statistically average within a flawed sample.
The Population-Based Approach
Clinical laboratories establish reference ranges by collecting samples from a reference population, typically spanning a wide demographic. According to guidelines from organizations like CLSI and related statistical frameworks, the central 95% of those results becomes the "normal" interval. This means 2.5% of perfectly healthy people will fall outside the range on either end by pure statistics alone. Here is what that approach does not account for:
Unhealthy participants: Reference populations often include individuals with subclinical conditions that have not yet been diagnosed
Age and sex variability: Many ranges are not stratified by age, sex, or ethnicity, even though key biomarkers shift significantly across these groups
Lifestyle factors: Sedentary individuals, smokers, and people with poor diets are included alongside athletes and health-optimized individuals
Regional differences: Canadians living at northern latitudes face different vitamin D exposure than reference populations sampled in southern climates
Why "Normal" Does Not Mean "Healthy"
A fasting glucose reading of 5.6 mmol/L sits within the standard reference range in most Canadian labs. Yet research in metabolic health consistently flags readings above 4.7 to 5.0 mmol/L as early indicators of insulin resistance, particularly when combined with elevated triglycerides. Someone receiving that 5.6 result is told everything looks fine, while a more nuanced interpretation would trigger a conversation about fasting glucose patterns and dietary intervention. This pattern repeats across dozens of markers, from thyroid hormones to inflammatory proteins, where the clinical "normal" encompasses a wide band that includes both genuinely healthy values and early warning signals.
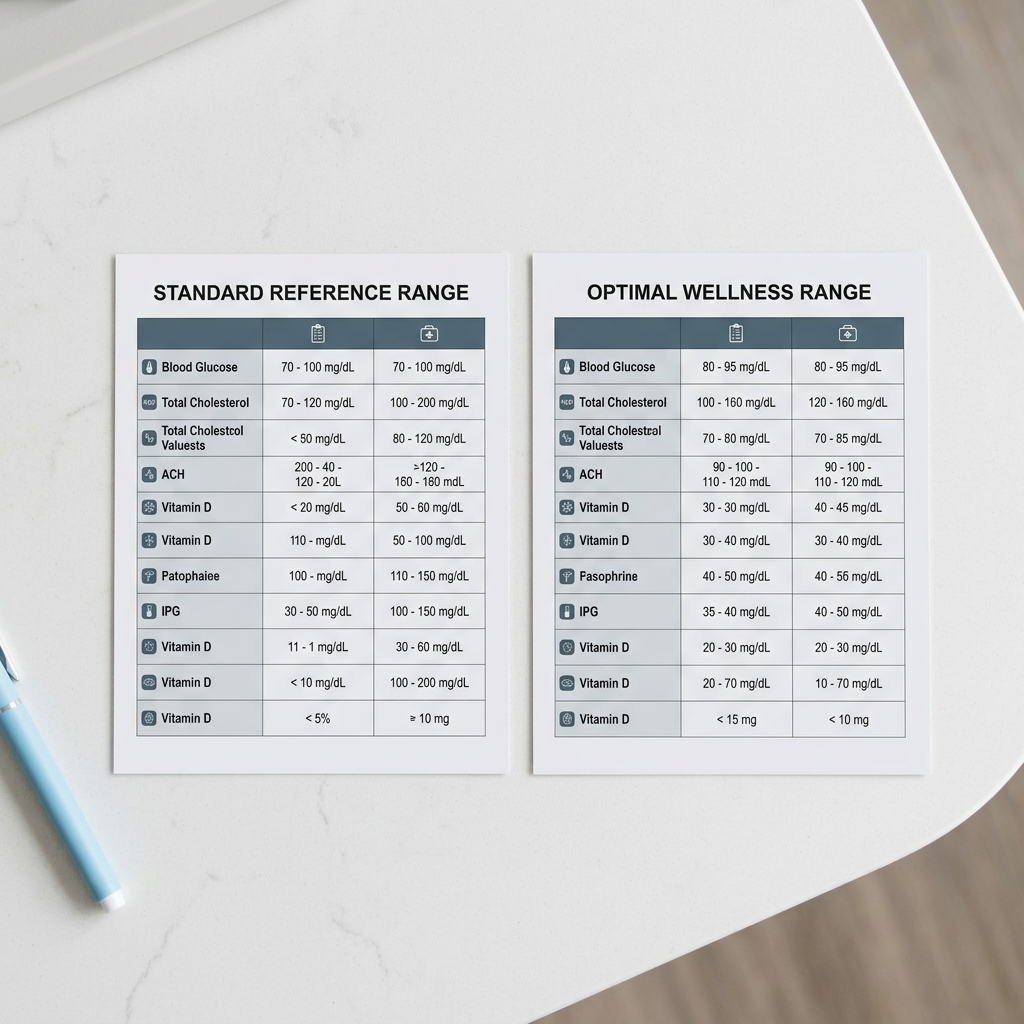
Where Optimal and Normal Ranges Diverge in Practice
The concept of optimal ranges draws from functional medicine, longevity research, and emerging evidence in preventive health testing. Rather than asking "is this person sick enough to treat?", an optimal framework asks "is this person functioning at their best?" That shift changes the clinical picture dramatically for several common health biomarkers.
Five Biomarkers Where the Gap Matters Most
Looking at specific markers side by side makes the disconnect between standard and optimal interpretation concrete. These are among the most frequently tested values in a comprehensive blood panel, and each one carries a meaningful gap between what labs call normal and what the evidence supports as optimal.
Vitamin D (25-hydroxyvitamin D) is a prime example. Standard Canadian lab ranges typically flag anything below 25 nmol/L as deficient and consider 75 nmol/L adequate. Yet research on vitamin D and immune function suggests that levels between 100 and 150 nmol/L are associated with better bone density, mood regulation, and reduced infection risk. A reading of 60 nmol/L passes the standard test but falls well short of what the body needs for peak performance, particularly during Canadian winters.
TSH (thyroid-stimulating hormone) follows a similar pattern. The standard range typically spans 0.4 to 4.5 mIU/L. Functional practitioners and recent literature narrow the optimal window to roughly 1.0 to 2.5 mIU/L. Someone sitting at 3.8 may experience fatigue, weight gain, and brain fog, yet a standard thyroid panel would report no abnormality. Only when TSH creeps past 4.5 does the conventional model raise a flag, often years after symptoms began. Ferritin, hs-CRP, and HbA1c each follow this same trajectory, where "normal" leaves significant room for undetected dysfunction. Ferritin below 30 ng/mL frequently coincides with fatigue and hair loss in women, even though many labs set the lower cutoff at 12 to 15. High-sensitivity C-reactive protein is considered normal up to 3.0 mg/L, but values above 1.0 already carry an inflammation risk worth monitoring.

What This Means for Aging and Longevity
Aging biomarkers shift gradually over decades, making it easy to dismiss year-over-year changes when each result remains within the lab's printed range. A fasting glucose that moves from 4.6 to 5.4 over five years is technically normal at every checkup. But that trajectory, when plotted alongside rising metabolic biomarkers like triglycerides and insulin, reveals a clear metabolic drift that merits intervention long before a diabetes diagnosis.
This is where biomarker tracking over time becomes essential. A single snapshot tells you where you are today relative to a population average. Longitudinal data tells you where you are heading relative to your own baseline. For Canadians serious about longevity and health optimization, tracking your own data is far more powerful than comparing one result against a wide reference band built from strangers. Biomi structures its testing tiers around this principle, pairing a comprehensive biomarker panel with longitudinal comparison so that subtle shifts get caught early rather than years down the line. That kind of proactive monitoring approach transforms raw lab numbers into personalized health insights that drive real decisions.
Conclusion
A "normal" result on your blood work does not guarantee that your body is functioning at its best. Standard reference ranges serve a purpose in ruling out acute pathology, but they were never designed to guide health optimization or early prevention. By understanding the difference between normal and optimal values across critical markers like glucose, thyroid hormones, vitamin D, and inflammatory proteins, you gain the ability to read your own results with sharper eyes. The next time you review a lab report, look beyond the word "normal" and ask whether those numbers reflect where you want to be, not just where the population average sits. Taking that step is the foundation of genuine preventive care.
Explore Biomi's advanced biomarker testing to see how your results compare against both standard and optimal ranges.
Frequently Asked Questions (FAQs)
What is the difference between optimal and normal biomarker ranges?
Normal ranges represent the statistical middle 95% of a population sample (which includes unhealthy individuals), while optimal ranges are narrower windows associated with peak physiological function and lower disease risk based on current research.
Can biomarkers reveal nutrient deficiencies before symptoms appear?
Yes, markers like ferritin, vitamin D, and B12 often drop below optimal thresholds months or even years before clinical deficiency symptoms such as fatigue, hair loss, or cognitive decline become noticeable.
What biomarkers are most important for women over 40 in Canada?
Women over 40 should prioritize thyroid hormones (full panel including free T3 and T4), ferritin, vitamin D, fasting insulin, HbA1c, and sex hormones like estradiol and progesterone to catch perimenopause-related shifts early.
How often should Canadians retest biomarkers for meaningful trends?
Testing every three to six months provides enough data points to identify meaningful trends, though individuals managing a specific concern or making major lifestyle changes may benefit from quarterly retesting.
Which biomarkers best predict cardiovascular risk vs standard cholesterol?
ApoB, Lp(a), hs-CRP, and the triglyceride-to-HDL ratio are stronger predictors of cardiovascular risk than total cholesterol or LDL alone, as they reflect particle count, inflammation, and metabolic health more accurately.
About the author

Medical Research Content Advisor
Combines medical research and functional medicine expertise to create educational content on health biomarkers, disease prevention, and longevity.
Related articles
- Iron Deficiency Symptoms, Causes & Treatment: A Complete Guide
Learn how to recognize iron deficiency symptoms, understand root causes, and explore proven treatments. Discover how biomarker testing helps you track and improve your iron levels.
- How Often Should You Track Blood Biomarkers for Real Results?
Learn how often you should retest blood biomarkers to track real health progress. Get evidence-based retesting schedules for longevity and performance goals.
- Health Dashboard vs Fitness Tracker: Which Actually Improves Wellness?
Health dashboard or fitness tracker—which truly reveals your wellness? Discover how biomarker tracking outperforms wearables for preventive health insights.
- How Chronic Inflammation Accelerates Aging and How to Stop It
Learn how chronic inflammation speeds up aging and what you can do to stop it. Discover actionable steps, key biomarkers, and testing options available in Canada.
- Micronutrient Deficiency: Signs, Testing, and How to Fix It
Learn to spot micronutrient deficiency symptoms, understand blood testing options in Canada, and discover how to restore optimal levels for lasting energy and health.
Read article: Iron Deficiency Symptoms, Causes & Treatment: A Complete GuideRead article: How Often Should You Track Blood Biomarkers for Real Results?Read article: Health Dashboard vs Fitness Tracker: Which Actually Improves Wellness?Read article: How Chronic Inflammation Accelerates Aging and How to Stop ItRead article: Micronutrient Deficiency: Signs, Testing, and How to Fix It